A Security Information and Event Management (SIEM) tool helps organizations with large IT infrastructure to detect, analyze, and respond to the various security threats they face. Event log data is fed into the SIEM from a variety of sources and it can then be manually searched for suspicious activity or even be set up to automatically detect and take action on threats before they become a big problem. There are a number of SIEM tools available for use like Splunk, SolarWinds, Elastic Stack, but I’m going to demonstrate how I set up a custom SIEM using Sentinel within Microsoft Azure.
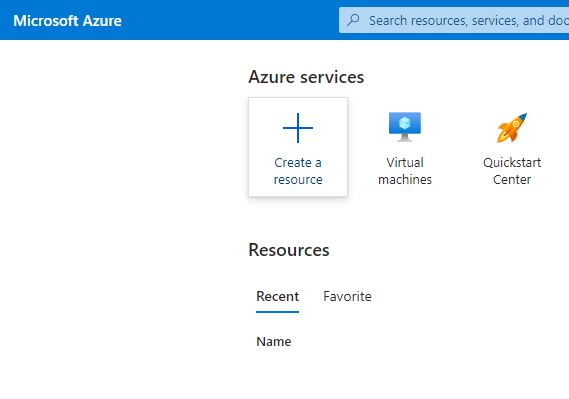
The first step is to create a virtual machine which can be done in the Azure Portal by selecting ‘Create a resource’.
From here a virtual machine can be selected for creation and there will be several fields to complete and choose options for. A subscription needs to be selected, a new ‘Resource group’ needs to be created, and a virtual machine name, region, OS image, size, username and password for the virtual machine all need to be set.
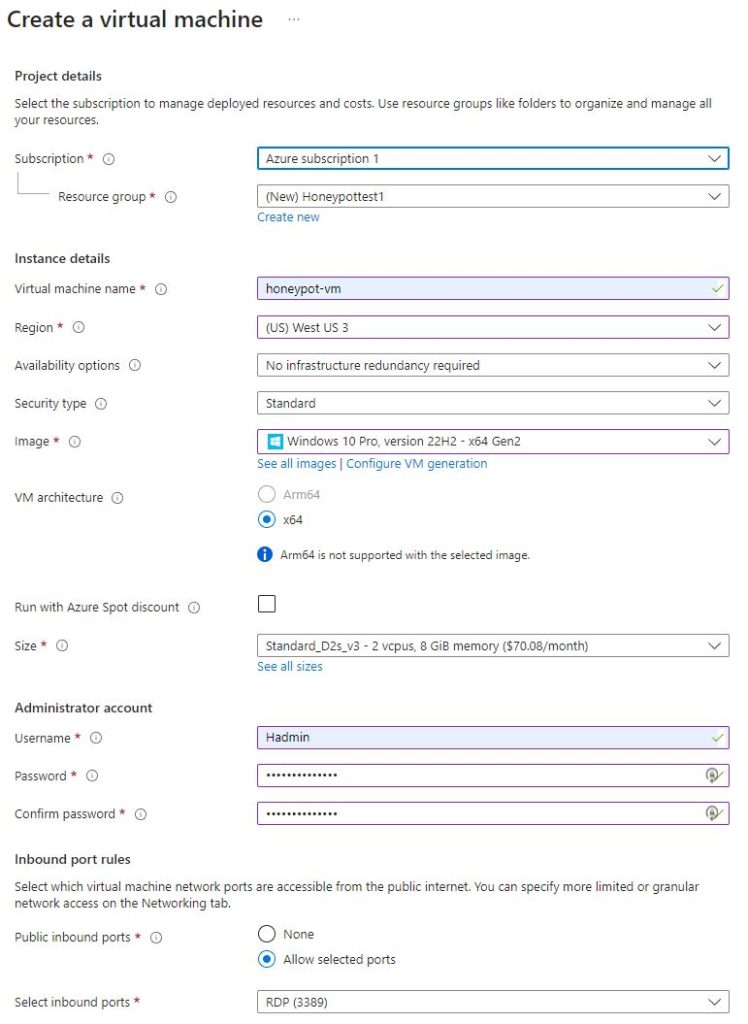
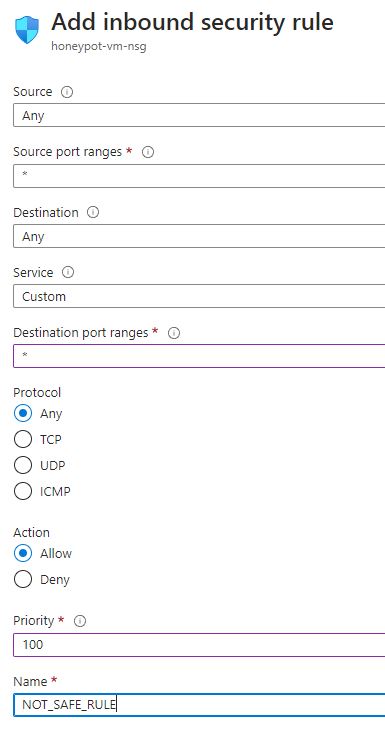
Next a new inbound security rule needs to be created to allow people from around the world to discover and interact with the virtual machine. This is not normally a good practice, but for this exercise an exception will be made so the SIEM can be populated with data. With all the necessary options and rules configured the virtual machine is created.
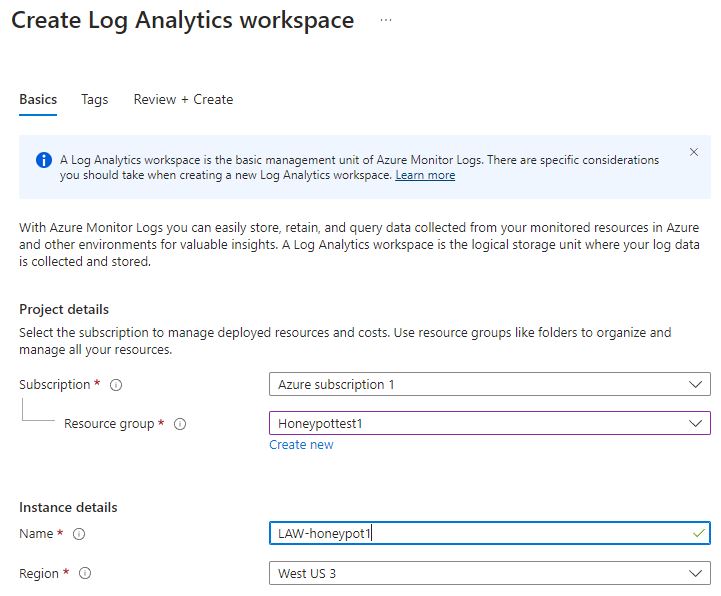
The next step is to create a custom ‘Log Analytics Workspace’ so the custom log that will be created will be imported from the virtual machine into Sentinel. As with the virtual machine, a few fields need to be completed and then the new workspace can be created.
To ensure that the log can be imported a few more settings need to be adjusted in ‘Microsoft Defender for Cloud’. From here the Environment settings section contains the path to adjust Microsoft Defender options. The Foundational CSPM and Servers are turned on, and the SQL server is turned off since it is not needed.

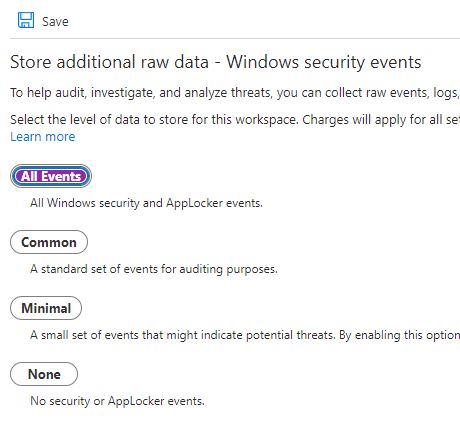
After saving those settings the ‘Data Collections’ section must have ‘All Events’ selected so that everything is collected from the custom log.
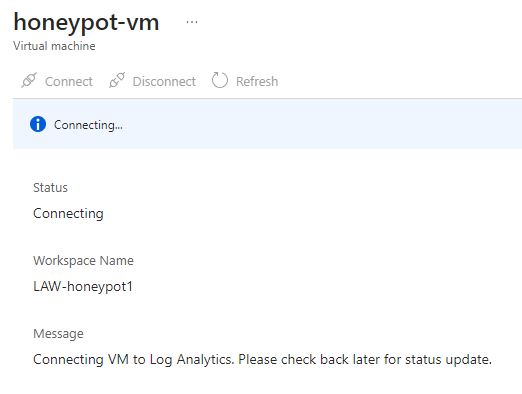
Back in the ‘Log Analytics Workspace’ the virtual machine must be connected to the new workspace.
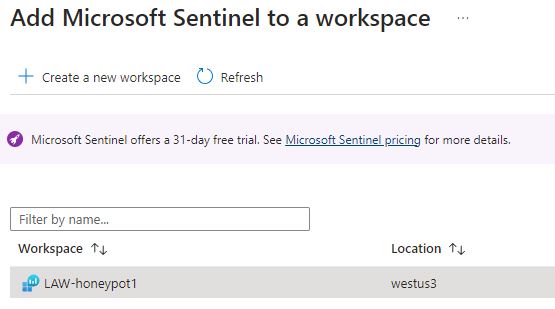
Now Sentinel can be set up by searching for it in the Azure Portal. From the Sentinel dashboard the workspace can be selected and have Sentinel added to it.
Now enough time has passed that the virtual machine is finished being created and will have an IP address that can be used to login to it remotely with RDP (Remote Desktop Protocol). RDP can be accessed through the Start menu and searching for it. The virtual machine’s IP address is used as well as the credentials that were assigned to it during creation to log into it remotely.
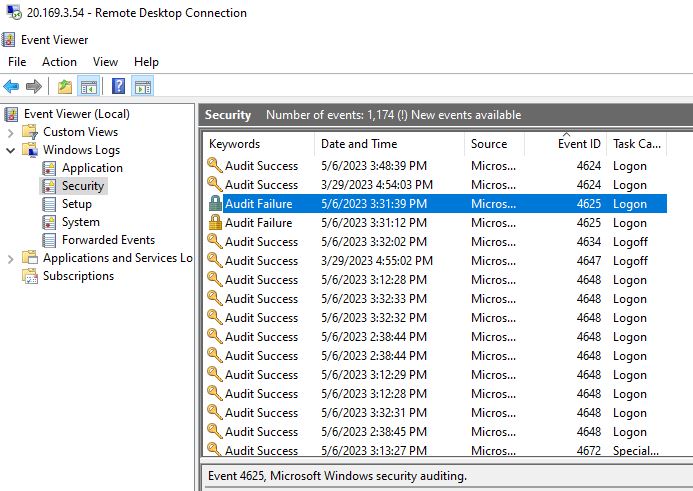
From the virtual machine the Event Viewer needs to be opened so that the EventID for failed logins can be identified. This Event will have useful information for failed login attempts like the username and source IP.
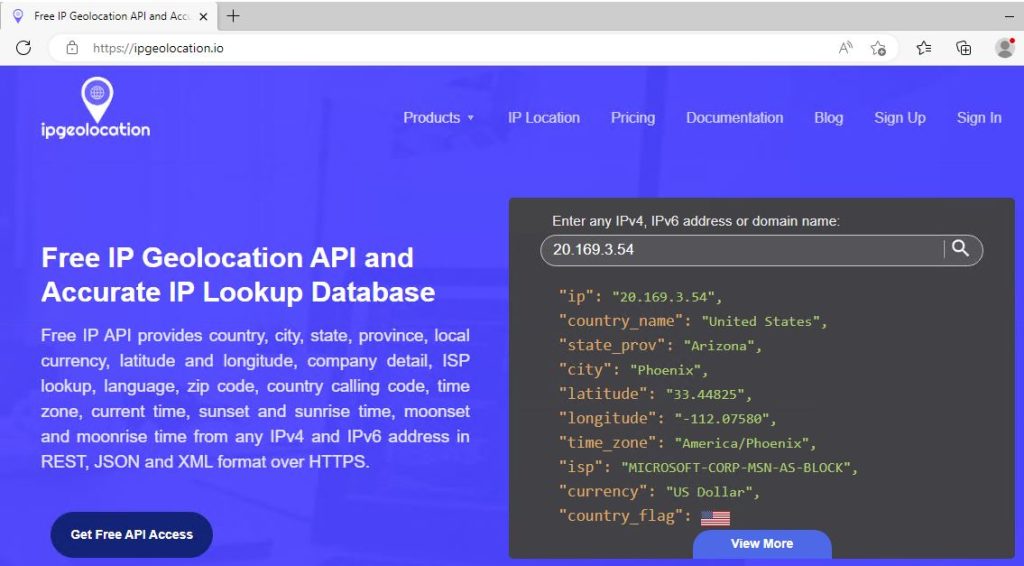
To get the needed geographic information for each IP an API can be used such as the one at https://ipgeolocation.io which will gather all the information in the next image. By setting up an account the API key will be provided for free for limited use.
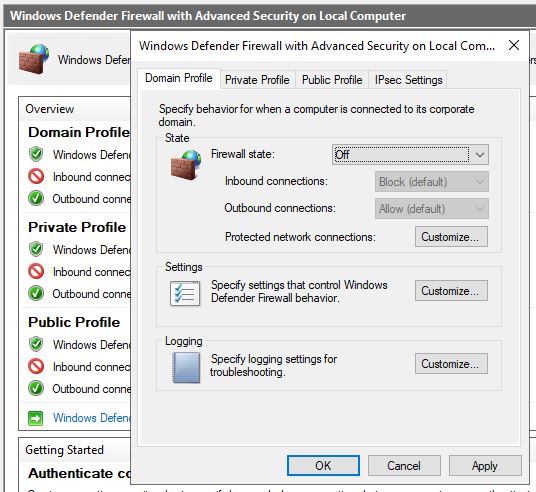
The virtual machine firewall will also need to be adjusted so that it can be discovered by ICMP echo requests. This can be done by searching for ‘wf.msc’ in the start menu on the virtual machine and adjusting the ‘Windows Defender Firewall Properties’. The firewall states for the Domain Profile, Private Profile, and Public Profile can all be set to ‘Off’. This is not considered a good security practice but for this exercise the virtual machine needs to be discoverable.
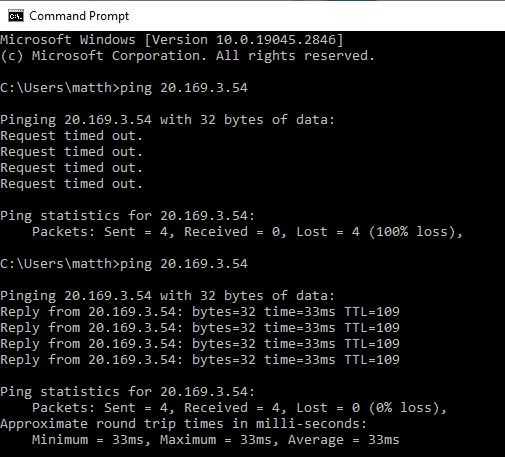
To check if it worked a ‘Ping’ command can be run from a different computer on the virtual machine’s IP address. It will be successful if the requests do not time out.
Back in the virtual machine a Powershell script will need to be run with Powershell ISE which can be found by searching for it through the Start menu. A script for this purpose was found online and the only editing that needed to be done was to change the API key for the geolocation API.
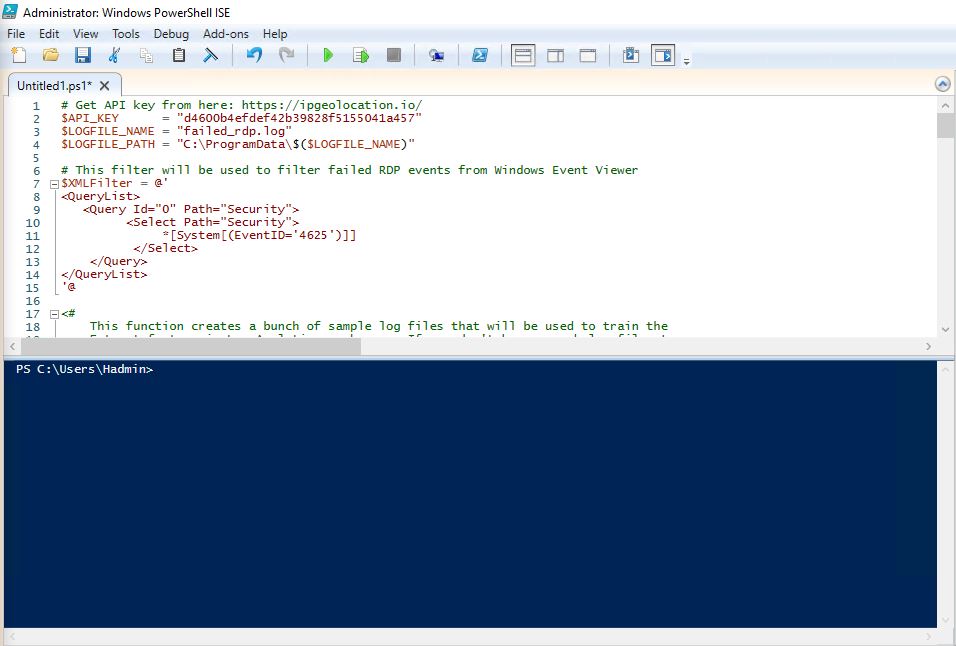
The script will look through the Event Security Log and grab all the failed attempts of people trying to remote access into the virtual machine using RDP. After running the script, it doesn’t take long to catch some failed attempts as the virtual machine has already been discovered.

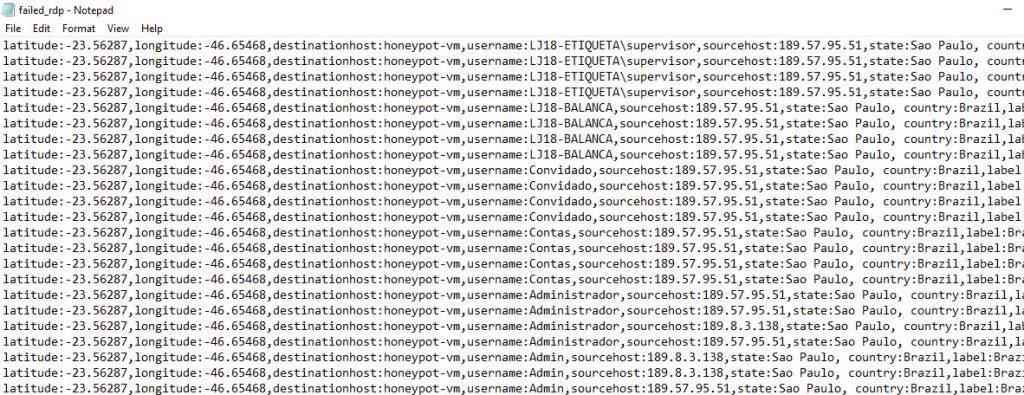
The file location of the log needs to be recorded so it can be fed into Sentinel later. The log file already contains several events of failed login attempts. Unfortunately, it can be difficult to read as is, but that will be fixed by parsing and extracting the fields using Sentinel.
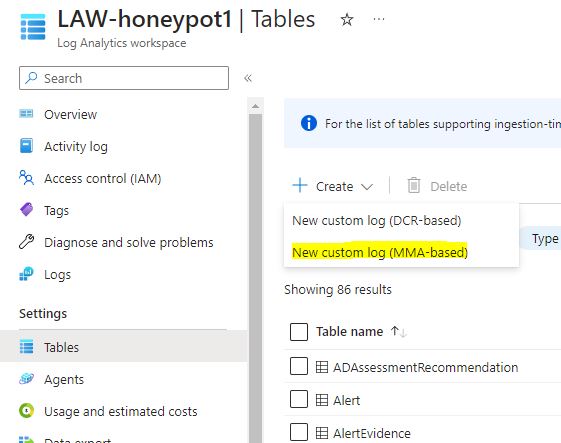
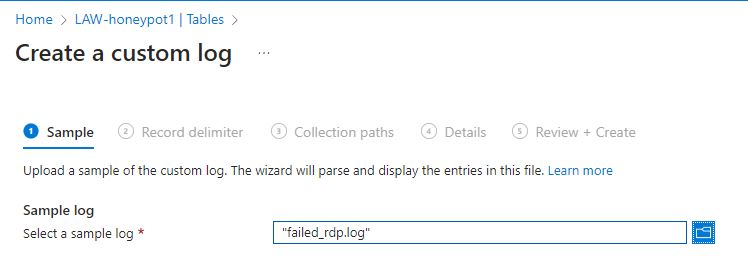
Back in Azure a new custom log will need to be created in the ‘Log Analytics Workspace’ that was set up earlier. This is found under Settings -> Tables and then by creating a ‘New custom log (MMA-based).
It asks for a sample log file and the new log that was created on the virtual machine is what will be used. This will essentially help us to train the ‘Log Analytics’ to know what it needs to look for in the log file.
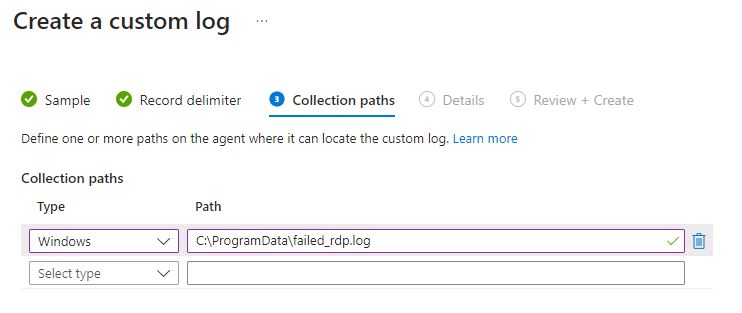
Moving ahead to ‘Collection paths’ it will ask for the type of OS, which is Windows, and the path to the log file on the virtual machine itself.
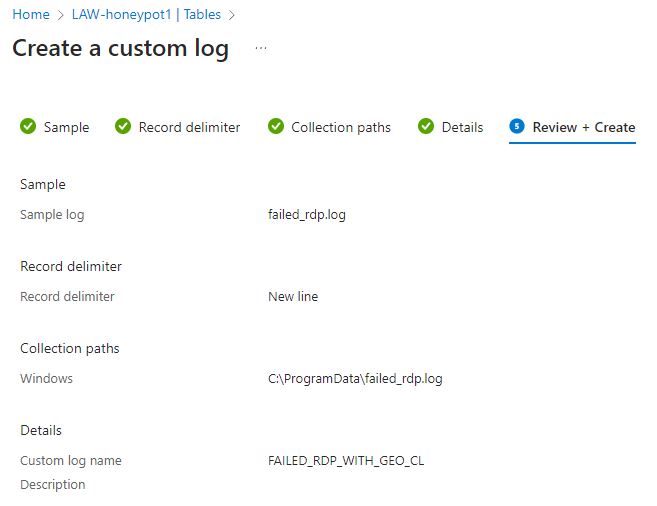
The log will be named under ‘Details’ and then it can finally be reviewed and created.
When the log is finished it can be run to ensure that it is working properly. Back in Microsoft Sentinel under the ‘Logs’ section a query can be run on the name of the newly created log. This should bring up all the failed login attempts that are currently in the log if it was set up properly.
In order to make use of the geolocation API some new custom fields will need to be extracted from the RawData field. The RawData field contains all of the fields that are needed but it won’t be able to parse the data by itself without some manual set up. To do this one of the rows in the search results can be ‘right clicked’ and it will give the option to ‘Extract fields’.
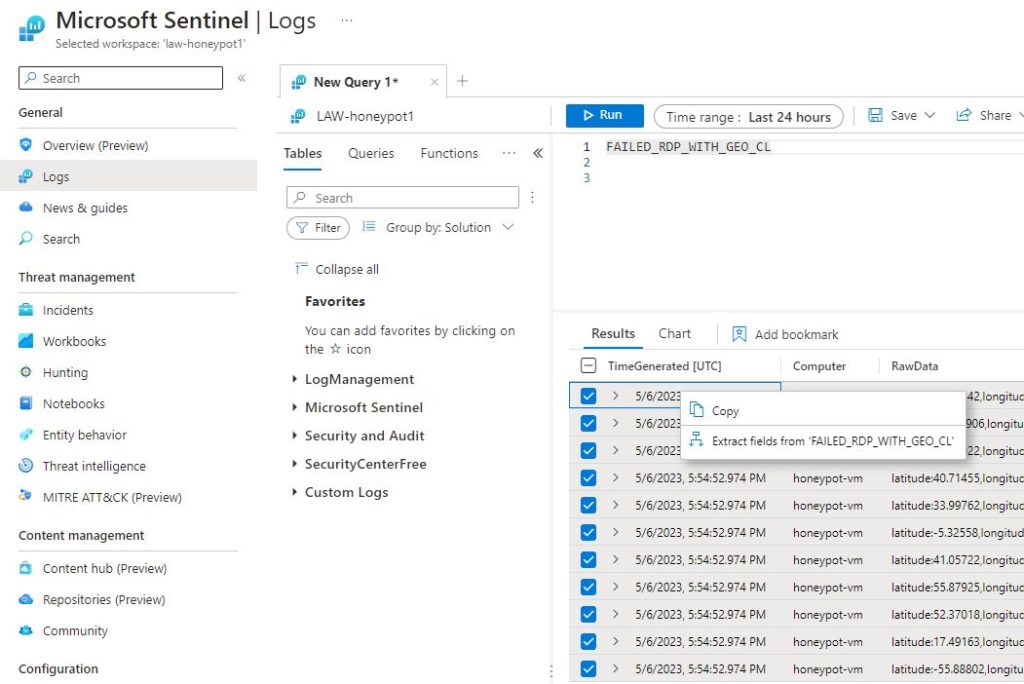
To set the custom fields the value of the field needs to be highlighted and a pop up will appear allowing the name of the field to be set and the field type. This needs to be done for latitude, longitude, destinationhost, username, sourcehost, state, country, label, and timestamp.
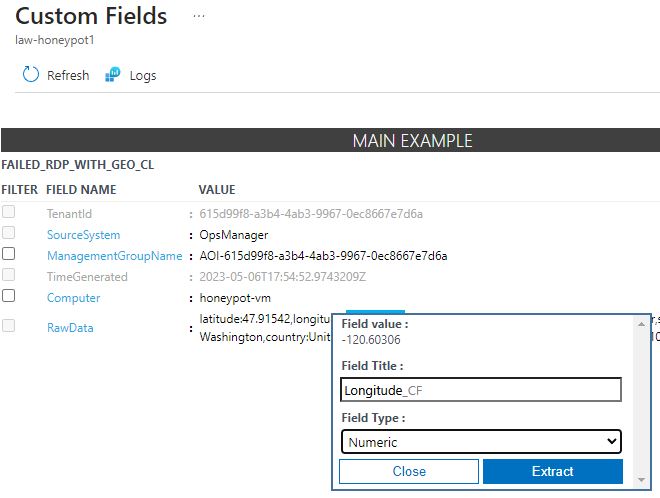
After selecting ‘Extract’ the search results will appear and Azure will highlight all the field values for the selection of results. However, it often will not do this perfectly and will require manual adjusting.
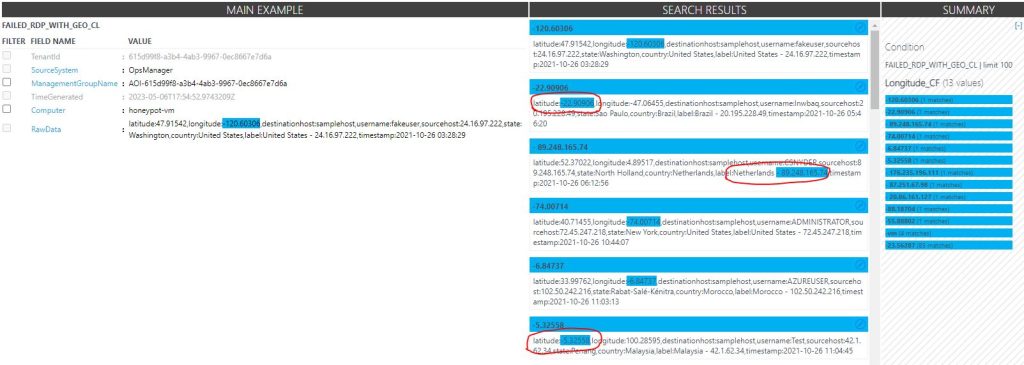
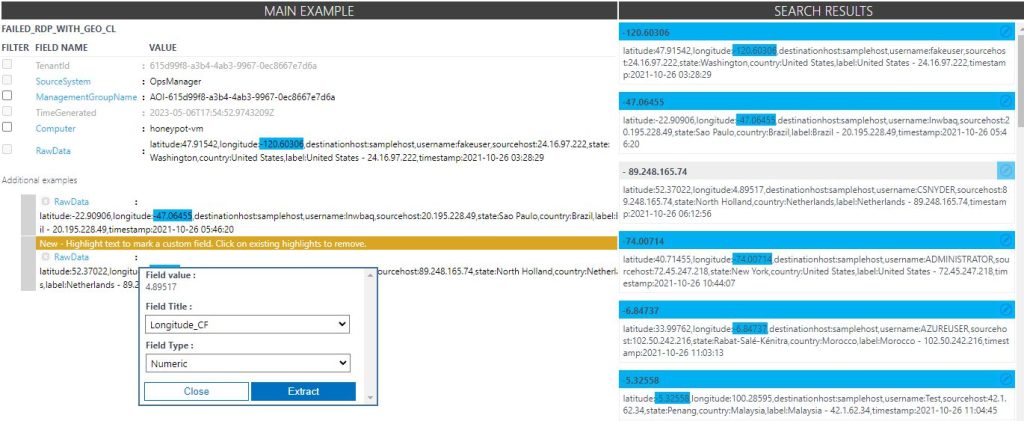
Incorrect samples can be selected for editing, and the correct field value needs to be highlighted and extracted. This often just takes one or two edits to get all the field values pulled correctly.
When all the custom fields have been extracted the search can be run again to make sure the fields are now included in the search results. It’s wise to check the actual log in the virtual machine against the search results for extra confidence that it is working as it should.
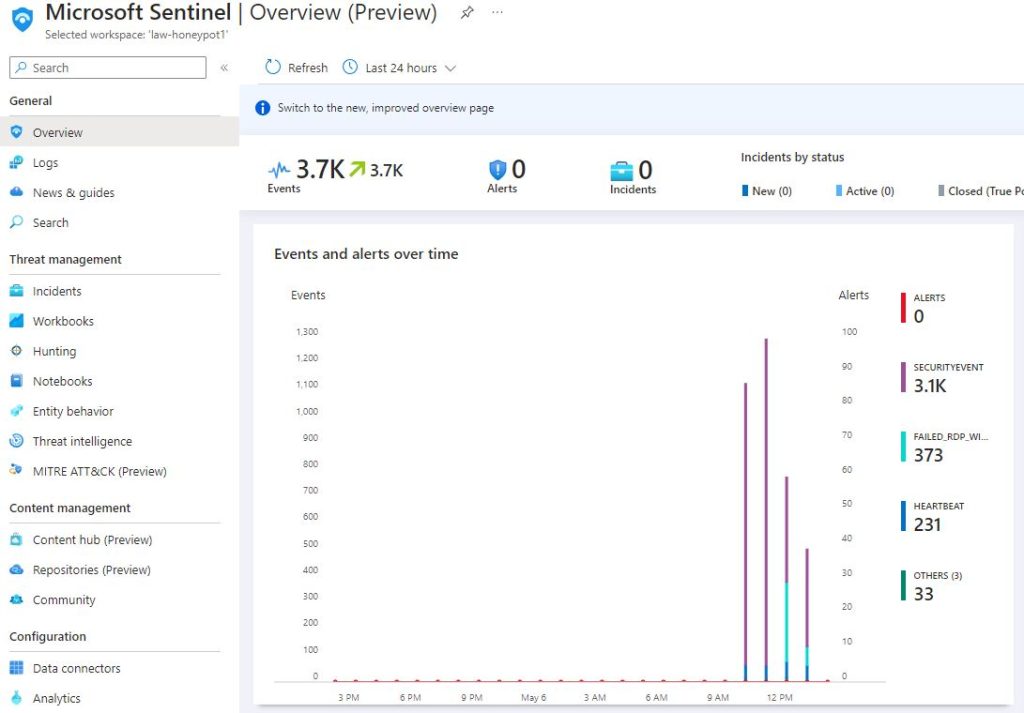
In the Sentinel dashboard there is an ‘Overview’ page that will show events already being sent from the log.
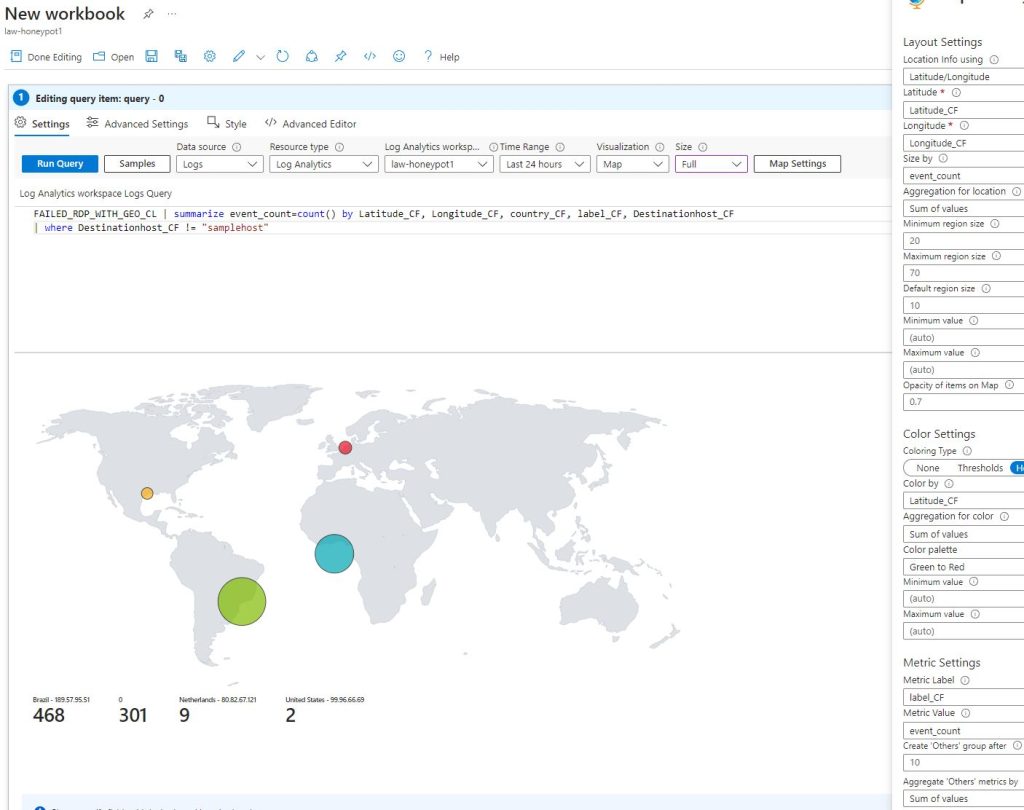
To set up a graphical display of where the failed login attempts are coming from a ‘New workbook’ can be set up in the ‘Workbooks’ page under ‘Threat Management’. A new query will replace any that are present in the new workbook and this will require a new search string. It needs to search the custom log and summarize the count of all the events by sourcehost, latitude, longitude, country, label, and destinationhost. Any sample events that were used to help set up the custom fields can be excluded as well. If the search query was done correctly, it will return some results from the log.

The Visualization setting can be set by map to create a nice visual representation of where the login attempts are coming from. There’s a lot of customizable options for the map but in this case each event was set by latitude and longitude. The remaining settings can be adjusted as desired. In this exercise the majority of the failed login attempts were initiated from Brazil.
